

2.0 Driving Force – Climate Change

Le rapport sur l’état de l’environnement 2022 est un document technique destiné à un usage interne. Il n’est disponible qu’en anglais.
Introduction
This section discusses environmental trends and phenomena occurring in the NWT or Arctic in general. These focal points include trends in historical and projected temperature and precipitation in the NWT, and trends in lightning in the NWT and Arctic.
The Arctic is known to experience the effects of climate change to a far greater degree than the global average. For this reason, the NWT, and the Arctic in general, may be considered the “front lines” of climate change. This group of indicators tracks trends in environmental conditions occurring in the NWT, or projected to occur in the NWT, which illustrate the effects of climate change on the NWT.
2.1. Trends in observed temperature and precipitation in the NWT
This indicator tracks the observed annual and seasonal trends in air temperature and precipitation in the Mackenzie District and Arctic Tundra climate regions (Figure 1), and in individual communities in the NWT. There are numerous ways to evaluate trends in climate data. In this section, changes in air temperature from normal values are assessed. Normal values, also called baseline, are measured over a 30-year reference period. Daily mean annual air temperature and precipitation data are presented for specific NWT communities to demonstrate the observed climate trends in different regions of the NWT, including the increasing trend in air temperatures in both the southern and northern NWT.
The climate in the NWT, and in Canada as a whole, is wide ranging and varies spatially from one region to another. See Figure 1 for an illustration of the wide variety of climate regions in Canada. Natural climate variability can also occur on various temporal scales, seasonally, from one year to another, and at longer time scales up to decades for the Pacific Decadal Oscillation.
This indicator was prepared by the Government of The Northwest Territories, Department of Environment and Climate Change, with data obtained from Environment and Climate Change Canada (ECCC). An analysis of climate departures (differences from the normal) was conducted by ECCC, while the interpretation of historical annual temperature and precipitation trends specific to NWT communities has been provided by ECC.

NWT Focus
This indicator identifies observed trends in temperature and precipitation within the NWT from 1948 to 2020. Identifying these parameters provides an indication of current changes and anomalies in climate occurring within the NWT, illuminating possible environmental changes which may be occurring or which may be expected to occur, and allowing for study of weather and climate effects on the environment. For example, large departures from normal can be used to analyze climatic effects on wildlife, habitat disturbances such as fires or floods, and the ability of people to travel or harvest from the land.
Current View: status and trend
Temperature – Regional
Despite the low density and shorter historical record of the northern climate observing network (see Technical note), ECCC has very high confidence that temperature datasets are sufficiently reliable for computing regional temperature averages everywhere in Canada (Ref. 2).
The Mackenzie District includes all of the forested area of the NWT, and the Arctic Tundra consists of all tundra ecozones in the NWT, as well as most of Nunavut and northern Quebec. Figures 2 to 6 show annual, spring, summer, fall, and winter temperatures for the Mackenzie District and the Arctic Tundra regions. The data shown in these figures represents the departures from the mean observed climate normals over the 1961 to 1990 reference period. The five-year moving average trend is also shown.
In all instances, there was an increasing trend in air temperature, but this increase was particularly rapid in winter. It was this increasing winter trend that drove the overall significant increasing trend in annual air temperatures (Ref. 2). The strongest regional trend (+2.8 °C) in Canada was observed in the Mackenzie District region of the Northwest Territories.
These warming trends are also congruent with what is being reported by traditional knowledge holders. The Inuvialuit, for example, have reported generally warmer winters with less extreme cold days, however they have generally not reported warmer summers, although some have reported more extremely hot summer days (Ref. 4).

Temperature departures from normal varied greatly between years in the NWT. In addition to these large fluctuations, temperatures in the past 20 years have been, in general, warmer in all seasons as compared to the 1961 to 1990 reference period (Figure 2).

Spring temperatures were variable with a long-term trend towards a warmer climate. The range of temperature conditions also increased over the last two decades, with more variability in air temperatures observed in both the Mackenzie District and the Arctic Tundra regions. The warmest spring on record in the Mackenzie District and Arctic Tundra regions was in 2010, with a +5.2°C departure from the 1961 to 1990 reference period in both regions (Figure 3).

Summers, in general, shifted to slightly warmer than normal temperatures during the most recent 20 years in both the Mackenzie District and the Arctic Tundra regions. The warmest summer on record in the Mackenzie District and Arctic Tundra regions was 1998, with departures from the 1961 to 1990 reference period of 2.5°C and 2.7°C, respectively (Figure 4).
Seasonality is the predictable periodic variation in time series data around a trend line with a duration less than a year. The observed seasonality in warming trends can largely be explained by the seasonality of energy exchanges between land, the ocean, and the atmosphere. In the spring and early summer there is a large heat exchange from the atmosphere towards melting snow and ice, and then later in the summer, towards warming ice-free water bodies, including large lakes and the ocean. This causes warming in the summer to be less pronounced than during the winter.

Fall temperatures were highly variable but, in general were warmer than normal over the past 20 years in both the Mackenzie District and the Arctic Tundra. The warmest fall season on record in both of these regions was in 1998, with a 3.5°C departure in the Mackenzie District, and a 4.9°C departure from the 1961 to 1990 reference period in the Arctic Tundra (Figure 5).

The greatest increase in winter temperatures in all of Canada has occurred in the Mackenzie District. In 2006, winter temperatures were 6.3°C warmer than the 1961 to 1990 baseline. In the Arctic Tundra region, the greatest departure from winter baseline conditions occurred in 2010, when air temperatures were 5.6°C above the baseline (Figure 6).
Seven of the ten warmest winters ever observed in the Mackenzie District (compared to the 1961 to 1990 reference period) have occurred since 2006. In the Arctic Tundra, six of the ten warmest winters ever observed have occurred since 2006. Normal climatic variations cannot explain the frequency and magnitude of winter warming in the NWT.
Temperature – Community-Specific
In the NWT, warming has occurred three times faster than the global rate overall (Ref. 2). However, there has been a great deal of variety in warming rates in different parts of the territory. This is highlighted when comparing temperature trends in different communities. Mean annual air temperature trends have been evaluated for Hay River and Inuvik from 1957 to 2020 (63 years) to compare temperature trends across a latitudinal gradient (Figure 7, Table 1). Temperature trends in Hay River indicate a warming trend of 2.7°C over 63 years, and temperature trends in Inuvik indicate a warming trend of 4.4°C over 63 years (over 1.5 times more than Hay River and four times the global rate). These discrepancies in warming can be explained by the process of Arctic Amplification, which amplifies warming in higher latitudes (Ref. 5). One significant cause of Arctic Amplification (Ref. 5) is the reduction in sea ice and snow as temperatures warm. This in turn causes increased absorption of heat from solar energy due to the lower reflectivity (higher heat-absorption ability) of darker sea water and land not covered in ice and snow. This increased heat absorption further accelerates the already warming trend, causing a positive feedback loop.
Table 1 compares the increase in air temperature by season for Inuvik and Hay River from 1957 to 2020; it shows that the most significant warming occurred in the winter and the least warming occurred in the summer, similar to the pattern shown for the majority of NWT in Figures 4 and 6.

The data for the mean annual temperature trends shown for Hay River and Inuvik (Figure 7, Table 1) has been obtained from ECCC’s adjusted and homogenized historical record, dating back to the 1950s (Ref. 6). Trend analysis was conducted by ECC.
Table 1. Comparison of the increase in temperature by season over the historical record for Hay River and Inuvik between 1957 and 2020 (63 years).
|
|
Hay River (60.8°N) |
Inuvik (68.4°N) |
|
Spring |
2.2°C |
4.7°C |
|
Summer |
1.5°C |
1.7°C |
|
Fall |
1.4°C |
4.1°C |
|
Winter |
5.0°C |
6.7°C |
|
Annual |
2.7°C |
4.4°C |
Precipitation
Estimates of regional and national precipitation are more difficult to compute compared with air temperature. ECCC has low confidence that precipitation datasets are sufficiently reliable for calculating national precipitation averages for Canada from 1948 to 2019 (Ref. 2). Precipitation is difficult to accurately measure. This is in part due to the large sporadic nature of precipitation in time and space, which makes point observations at weather stations difficult to extrapolate over regions. Additionally, precipitation gauges catch only a portion of precipitation, and become less efficient as wind-speed increases. In the winter, snowfall is even more difficult to measure, complicated by drifting snow and sublimation (passing from solid to gas state without an intermediate liquid state). All of these factors affect the accuracy of precipitation measurements, and when compounded by the low number of precipitation gauges in Canada, and in particular the North, there is low confidence in accurately determining regional or national total amounts of precipitation (Ref. 2). As a result, ECCC uses locally normalized precipitation (the amount of measured precipitation divided by its long-term mean) to assess national and regional changes in precipitation expressed as a percentage.
It should also be noted that the evolution of precipitation monitoring technology from manual to automated systems has resulted in differences in measurements that require extensive data integration techniques to create a contiguous record extending from earlier historical observations to more recent observations. Unfortunately, such an integrated dataset is not available from ECCC at this time. The precipitation data used in this report has been sourced from ECCC, however this data does not represent the adjusted and homogenized dataset required to reconcile the recent and historical measurements.
Figures 8 to 16 show total precipitation, total rain, and total annual snowpack water equivalent (SWE) from 1955 to 2018 for Hay River, Yellowknife, and Inuvik. The SWE is computed by multiplying snow depth by snow density. These communities represent a latitudinal transect from the southern NWT to northern NWT. In general, more southerly locations receive more precipitation due to the greater capacity of the atmosphere to hold moisture at higher air temperatures. Hay River generally receives greater annual precipitation than Yellowknife, which usually receives more precipitation than Inuvik.


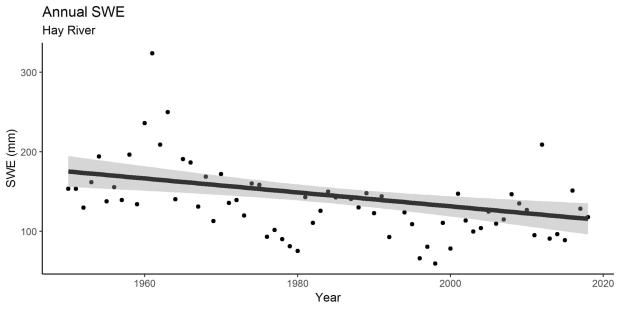
In Hay River, there have been no decipherable trends in total annual precipitation or total annual rain, since 1950. However, from 1950 to 2018 there was a decreasing trend observed in total annual SWE (Figures 8, 9 and 10).


In Yellowknife, increasing trends were observed in both total annual precipitation and total annual rain between 1950 and 2018. There was no trend detected in total annual SWE since 1950 (Figures 13, 14 and 15).


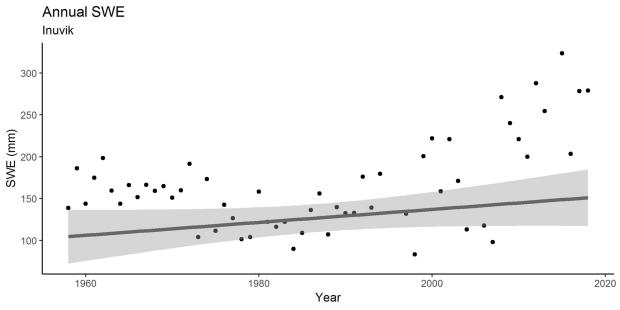
In Inuvik, there were no trends detected in total annual precipitation or total annual rain. There was an observed increasing trend in total annual SWE between 1955 and 2018 (Figures 14, 15 and 16).
The observed precipitation trends in Hay River, Yellowknife, and Inuvik are consistent with those of other northern locations, in that the magnitude and direction of trends varies between measurement sites. Although a 30% increase in precipitation has been observed in northern Canada from 1948 to 2012 (Ref. 2), Figures 8 to 16 show an increase in some locations and a decrease in others, showing the complexity of precipitation patterns. While Hay River, Yellowknife, and Inuvik are all close to large water bodies and have experienced significant warming over the last 30 years or more, the observed precipitation patterns in each community are different. Vincent et al. (Ref. 7) completed an analysis of precipitation trends using precipitation data from climate stations across Canada and observed the same type of variability (Figure 17).

Figure 17 illustrates the trends of various precipitation indices in Canada. Focusing on the NWT, there are instances of considerable regional variability in the magnitude and direction of the trends. These types of indices are important for providing insight into current and potential future impacts of ongoing climate change on residents, the natural environment, and on the economy. Precipitation is highly variable over short distances. Given the low northern station density and data quality problems with northern precipitation data it is difficult to detect trends. Hence, the differences in observed trends and, in many cases, inability to detect trends, helps to demonstrate the difficulty in planning for climate change adaptation in many communities. This demonstrates a need for increased site-specific long-term monitoring of climate trends to properly identify changes and necessary adaptation actions.
Looking around
All eleven climate regions in Canada exhibited positive temperature trends for annual average air temperature from 1948 to 2020 (73 years), averaging an increase of +1.8°C for the entire country (Ref. 3).
Historical trends in air temperature have not been spatially or seasonally uniform. Between 1948 and 2018, air temperature has risen on average by 2.3 °C in northern Canada. While world temperatures have increased by 0.8°C since 1948 (Ref. 2), on average across the north, warming has been more than three times the global rate (Ref 2) and increased at more than four times the global rate at some stations in the northern NWT.
Considerably more warming has occurred in the winter between 4 °C to 6 °C in some northern regions in the same time period. Between 1948 and 2016, mean air temperature in Canada increased by 3.3 °C in winter, 1.7 °C in spring, 1.5 °C in spring, and 1.7 °C in autumn (Ref. 2).
Warming trends have been more significant in the North, especially in the winter. Spring and fall warming has also been disproportionately greater in northern Canada compared to Canada as a whole, but summer warming in the North has been relatively consistent in magnitude with the rest of Canada (Ref. 2). See Figure 18 for a comparison of Canada-wide mean temperature changes for each season between 1948 and 2018.

Human activities have caused significant warming in Canada. Most (65%) of the warming can be attributed to human influence, while the rest (35%) can be explained by natural fluctuations of the Pacific Decadal Oscillation and the North American Oscillation (Ref. 2).
Changes in other temperature indices have been observed in addition to mean air temperature. For instance, between 1948 and 2016, the highest annual daily maximum temperature averaged across the country increased by 0.61 °C, with the largest increase observed in northern Canada. During the same time period, the annual lowest daily minimum temperature increased by a Canada-wide mean of 3.3 °C (Ref. 2). Overall, these trends indicate that daily minimum temperatures increased more rapidly than daily maximum temperatures. This is consistent with trends of greater warming in the winter than in summer, and greater warming of night temperatures compared with day temperatures.
Across Canada, a shorter winter season due to warming has extended the frost-free season by about 20 days from 1948 to 2016. The frost-free season is now starting approximately 10 days earlier and ending approximately 10 days later. At the same time, heating degree days (the annual sum of daily mean temperature below 18 °C) have decreased, while cooling degree days (the annual sum of daily mean temperature above 18 °C) have increased. As a result, the length of the growing season has also increased across Canada by approximately 15 days between 1948 and 2016 (Ref. 2).
Looking forward
Temperatures have increased across the NWT since records began, on both a regional and community-scale level, and these trends can be expected to continue into the future. Rising temperatures have primarily occurred over the winter season. Exceptionally warm winters, such as in 2006, should be expected with greater frequency in the future. Observed changes in temperature in the NWT have been larger than what is expected from natural climate variations and are consistent with what is predicted from climate change due to increased greenhouse gas emissions (Ref. 2).
Observed historical precipitation in individual communities indicates trends in some instances, and a lack of trends in others. On a seasonal basis, trends of increasing rainfall were observed in Yellowknife (Figure 12), with decreasing trends in SWE observed in Hay River (Figure 10) and increasing trends in SWE observed in Inuvik (Figure 16). On an annual basis, only Yellowknife exhibited an increasing trend in precipitation (Figure 11). By the end of the century, annual precipitation is projected to increase everywhere in the North, by up to 30% in some locations (Ref. 2) as higher temperatures allow the atmosphere to hold more water vapour (Ref. 9). Although not all stations are currently showing an increasing precipitation trend, it is likely that these trends will become increasingly pronounced in the coming decades.
It is important to continue monitoring long-term trends in precipitation, as changes are already occurring in some locations and are likely to be observed in other locations in the future. It is likely that instances of rain on snow events and wet, heavy snowfall will become more frequent in the future. Rain on snow events have been linked to increased mortality in Peary Caribou and Muskoxen populations on the High Arctic Islands as this leads to a layer of ice blocking access to food, while wet, heavy snow can result in roof collapses (Ref. 10-12).
For more details on projected changes in temperature and precipitation in the NWT, see ‘Projected temperature and precipitation in the NWT in Section 2.3 of this report.
Find out more
For more information on seasonal trends in the NWT and elsewhere in Canada, go to Climate Trends and Variations Bulletin published every season by the Climate Research Division of Environment Canada at https://www.canada.ca/en/environment-climate-change/services/climate-change/science-research-data/climate-trends-variability/trends-variations.html.
To read more about climate change in Canada, download the complete Canada’s Changing Climate Report at: https://changingclimate.ca/CCCR2019/.
For information about climate oscillations, including El Nino, see the indicator ‘1.4. Global teleconnections” in Focal point 1 A changing planet.
Technical Notes
Environment and Climate Change Canada (ECCC) maintains a meteorological observation system that provides current and historical climate measurements across the country. In the North, the climate monitoring network has been in place for only a short duration, on average, 70 years, compared to the approximately 120-year record in southern Canada. The station density in the NWT is much lower than that in southern Canada. ECCC operates 32 stations in the NWT which is a station density of one station per 42,100 km2 of land area. In Canada’s southern provinces, the station density is considerably higher: with one station per 10,270 km2 in British Columbia; 1: 12,300km2 in Alberta and 1:13,800 km2 in Ontario.
Temperature data used in Figures 2 to 7 is homogenized temperature data from Environment and Climate Change (ECCC) Canada developed using the methodology of Vincent et al. (Ref, 6). The Climate Research Division (CRD) of ECCC interpolates homogenized temperature data to produce a grid of temperature values. This grid is then used to generate climate summaries for the regions shown in Figure 1. The CRD provided data for this report used to generate graphs 2 to 6. Homogenized station data for Inuvik and Hay River was used to generate Figure 7 and Table 1 by ECC
The non-parametric Mann-Kendall test with the Kendall-Theil line was used by ECC to analyze total annual precipitation, total annual rain, and total annual SWE for Hay River, Yellowknife and Inuvik for trends (Figures 10 to 18; Ref. 13). No significant trends were identified for graphs no trend line present (Figures 10, 11, 15, 16, and 17).
References
Ref. 1. Environment and Climate Change Canada. 2020. Climate Trends and Variations Bulletin. ISSN: 2367-9794. Available at: https://www.canada.ca/en/environment-climate-change/services/climate-change/science-research-data/climate-trends-variability/trends-variations/annual-2020-bulletin.html
Ref. 2. Zhang, X., Flato, G., Kirchmeier-Young, M., Vincent, L., Wan, H., Wang, X., Rong, R., Fyfe, J., Li, G., Kharin, V.V. 2019. Changes in Temperature and Precipitation Across Canada; Chapter 4 in Bush, E. and Lemmen, D.S. (Eds.) Canada’s Changing Climate Report. Government of Canada, Ottawa, Ontario, pp 112-193.
Ref. 3. Environment and Climate Change Canada. 2021. Annual temperature trend, extremes and current year ranking, 1948-2020. CSV file. Accessed July 2021. Available at: https://www.canada.ca/content/dam/eccc/documents/csv/climate-trends-variations/annual2020/Annual_2020_summary_temp_table_e.csv
Ref. 4. Communities of Aklavik, Inuvik, Holman Island, Paulatuk and Tuktoyaktuk, Nickels, S., Buell, M., Furgal, C., Moquin, H. 2005. Unikkaaqatigiit – Putting the Human Face on Climate Change: Perspectives from the Inuvialuit Settlement Region. Ottawa: Joint publication of Inuit Tapiriit Kanatami, Nasivvik Centre for Inuit Health and Changing Environments at Université Laval and the Ajunnginiq Centre at the National Aboriginal Health Organization. Ottawa. Available at: https://www.itk.ca/wp-content/uploads/2016/07/Inuvialuit.pdf
Ref. 5. Serreze, M. C., R. G. Barry. 2011. Processes and impacts of Arctic amplification: A research synthesis. Global and Planetary Change. 77: 85-96.
Ref. 6. Environment and Climate Change Canada. 2020. Adjusted and Homogenized Canadian Climate Data. Available at: https://open.canada.ca/data/en/dataset/9c4ebc00-3ea4-4fe0-8bf2-66cfe1cddd1d
Ref. 7. Vincent, L.A., Zhang, X., Mekis, É, Wan, H., & Bush, E.J. 2018. Changes in Canada’s Climate: Trends in Indices Based on Daily Temperatures and Precipitation Data, Atmosphere-Ocean, 56:5, 332-349, DOI: 10.1080/07055900.2018.1514579
Ref. 8. Vincent, L.A., Megan M. Hartwell & Xiaolan L. Wang. 2020. A Third Generation of Homogenized Temperature for Trend Analysis and Monitoring Changes in Canada’s Climate, Atmosphere-Ocean, 58:3, 173-191, DOI: 10.1080/07055900.2020.1765728
Ref. 9. Collins, M., Knutti, R., Arblaster, J., Dufresne, J.-L., Fichefet, T., Friedlingstein, P., Gao, X., Gutowski, W.J., Johns, T., Krinner, G., Shongwe, M., Tebaldi, C., Weaver, A.J. and Wehner, M. 2013. Long-term climate change: projections, commitments and irreversibility; in Climate Change 2013: The Physical Science Basis; Contribution of Working Group I to the Fifth Assessment Report of the Intergovernmental Panel on Climate Change, (ed.) T.F. Stocker, D. Qin, G.-K. Plattner, M. Tignor, S.K. Allen, J. Boschung, A. Nauels, Y. Xia, V. Bex and P.M. Midgley; Cambridge University Press, Cambridge, United Kingdom and New York, NY, USA; p. 1029–1136, https://www.ipcc.ch/site/assets/uploads/2018/02/WG1AR5_Chapter12_FINAL.pdf
Ref. 10.Morrison, B.1978. Peary caribou: a study of natural mortality, south Banks Island, May 1978. Unpublished manuscript prepared for Northwest Territories Wildlife Service. 15 pp.
Ref. 11.Nagy, J.A. and Gunn, A. 2009. Productivity of Peary caribou and muskoxen on Banks and Melville islands, NT, July 2004. Environment and Climate Change, Government of the Northwest Territories, Inuvik, NT. Manuscript Report 204.
Ref. 12.Nagy, J.A., N.C. Larter and V.P. Fraser. 1996. Population demography of Peary caribou and muskox on Banks Island, N.W.T., 1982-1992. Rangifer, Special Issue No. 9:213-222.
Ref. 13. Granato, G.E. 2006. Kendall-Theil Robust Line (KTRLine-version 1.0) A visual basic program for calculating and graphing robust nonparametric estimates of linear-regression coefficients between two continuous variables: Techniques and Methods of the U.S. Geological Survey, book 4, chapter A7, 31 p.
2.2. Trends in lightning events
This indicator reports on trends in lightning events observed in the NWT.

This indicator was prepared by the Government of the Northwest Territories, Department of Environment and Climate Change, and is based largely on data from the Canadian Lightning Detection Network (CLDN).
NWT Focus
Wildfire is primarily a naturally occurring phenomenon which can significantly affect the environment in the NWT. Wildfires are beneficial in maintaining biodiversity, controlling insects and disease, and shaping landscapes (Ref. 1). However, a large number of fires and area affected by wildfire can impact the natural environment, affecting important wildlife habitat, substantially decreasing air quality, and threatening communities and developed infrastructure. This was experienced by many NWT residents firsthand in 2014, which was the most significant wildfire season ever recorded in the territory, causing air quality and visibility reductions, health alerts, and road closures (Ref. 1). With increasing temperatures and longer fire seasons due to climate change, wildfires are predicted to become a more common occurrence in the NWT.
In the NWT, most wildfires (88%) are initiated by lightning strikes (Ref. 2), meaning that the frequency, timing and location of lightning can be a strong indicator of wildfire numbers. As such, it is worth investigating trends in lightning events to help understand the future potential for wildfires in the NWT.
Current View: status and trend
Lightning is an electrostatic discharge caused by electric charge imbalances, and can occur as intra-cloud lightning, cloud-to-cloud lightning or cloud-to-ground (CG) lightning. When discussing lightning, there are several relevant terms that need to be understood. A lightning flash is a total discharge of CG lightning with a duration of approximately 0.2 seconds (Ref. 3). Each flash is made up of strokes, which are individual component discharges with durations of tens of milliseconds. Multiplicity refers to the number of strokes in a flash (Ref. 4). Lightning can be classified based on the type of charge (negative or positive) discharging from a cloud to the ground (Ref. 5).
There are three basic elements required for lightning to form – low-level humidity, convective instability, and a lifting mechanism. The latter two elements generally occur when there are warm surface air temperatures and cooler upper atmosphere temperatures, resulting in convective instability in which the warmer surface air rises to replace the cooler air above (Ref. 6). This rising air often creates thunderstorms and lightning. Lightning is frequently associated with atmospheric ridging (Ref. 1). Ridging is the development of warm, high-pressure elongated regions of the atmosphere. The breakdown or displacement of ridges is associated with the rising, unstable, moist air masses which are required to produce thunder and lightning. For example, the 2014 extreme wildfire season in the NWT was found to be accompanied by a higher frequency of ridging and ridge displacements than normal (Ref. 1).
In Canada, the federal government has operated the CLDN since 1998, a network of over 80 lightning sensors distributed across the country to monitor lightning events (Ref. 7). As the network was designed to assist with wildfire detection, there are no stations above the tree line. Therefore, the high Arctic is not represented in this data.
Burrows and Kochtubajda (Ref. 8) used the CLDN to investigate the prevalence of cloud-to-ground (CG) lightning (flash density) across Canada in a 20 km by 20 km resolution from 1999 to 2008. Their results indicated that the greatest flash density was in southern Canada along the border with the United States, and along the foothills of Alberta, with very little activity in the northern parts of Canada. In the NWT, the southern part of the territory experienced the most lightning days. Lightning was diminished over large distances to the lee side of large water bodies including ocean bodies and large lakes such as Great Slave Lake. The researchers suggested that this was due to cooling of westerly air masses as they passed over large water bodies, resulting in dampened convection.
In Figure 1, a map shows lightning flash density over the NWT for the 1999-2019 time period. Much like the 1999-2008 results, this map indicates that the average flash density is low; less than 1 event per km2 per year over most of the territory. More frequent lightning events are apparent in the very southern portion of the NWT, just south of Kakisa, where the flash density is between 7-8 events per km2 per year.

Figure 1: Lightning flash density (per km2 per year) from 1999-2019 in the mainland NWT. Source: B. Kochtubajda, ECCC. Figure provided to ECC by ECCC.
Figure 2 includes a bar graph showing a time series of the number of cloud to ground lightning flashes detected in the NWT between 1999 and 2018 using the CLDN data. This graph does not show any apparent trend in the frequency of lightning events. However, it should be noted that this data does not correct for the changes and improvements to the CLDN over the timespan represented. These improvements include upgrades to existing sensors and the addition of new sensors. Therefore, the data presented may not be representative of actual trends (or lack thereof) in lightning frequency.
Figure 2 shows that 2014 had an anomalously high number of lightning events. This may be a partial explanation as to why 2014 proved to be an intense fire season for the NWT.

Brown and Reuter (Ref. 6) used the CLDN to show a clear and statistically significant reduction in CG lightning detection frequency over the Canadian Shield. They investigated properties of their data to see if there were clues to suggest that the CLDN was not detecting lightning over the Canadian Shield as efficiently as over other areas. Results did not support this theory. Instead, they suggested that the difference in transpiration rate of vegetation in the Canadian Shield versus deeply soiled and agricultural areas causes fewer thunderstorms, and therefore lightning, over the Canadian Shield. There is previous research to suggest that agricultural lands tend to increase thunderclouds due to the ground heating up, leading to increased convection (Ref. 9).
Changes in lightning frequency over time in the NWT are not apparent using CLDN data (Figure 2). However, through analysis of data other than the CLDN, researchers have found mixed results when analyzing other data. For example, Holzworth et al. (Ref. 10) investigated lightning frequency in the Arctic from 2010-2020 using the World Wide Lightning Location Network (WWLLN), which spans the globe including the Arctic. They found that during the summer (June, July and August) average annual lightning strokes in the Arctic (above 65°N) increased over time in comparison to the number of strokes in more southerly latitudes. Figure 3 shows this trend, with a correction made for the increasing number of stations over time.

Brown et al. (Ref. 11) used the Global Lightning Dataset GLD360 network, a global lightning detection network privately owned by Vaisala (a separate network from the CLDN), to investigate a severe thunderstorm outbreak which occurred over the high Canadian Arctic islands. Over 15,000 strokes were identified north of the Arctic Circle, with an unusually high ratio of positive strokes. They found that the thunderstorm formed due to a southerly low-level jet of warm, moist air which flowed into an atmospheric low in the high Canadian Arctic. This warm, moist air then rose due to buoyancy, resulting in severe thunderstorms. By analyzing the data, the researchers were able to determine that this event was rare in the Arctic. Whether this event is related to the unusually high lightning flash frequency found in the mainland NWT in the same year (2014) by B. Kochtubajda (Figure 2) is unknown.
Looking forward
Based on existing analysis, there are no clear trends in lightning frequency in the NWT, so forward projection remains a challenge. Data from the CLDN does not show any clear trend, although it must be recognized that the network was established recently and has undergone changes in the number and quality of sensors of that time.
Some researchers, such as Holzworth et al. (Ref. 10) did find a trend of increasing lightning activity in the high Arctic. This finding is supported by Chen et al. (Ref. 12), who compared satellite observations of lightning flash rate and observed climate variables in northern circumpolar regions. This study observed that lightning flash rate was strongly correlated with both convective available potential energy (related to thunderstorms) and precipitation. They then applied this relationship to climate models (CMIP5) and observed how lightning changed in areas with abundant permafrost. They found that model projections for the high-emissions scenario (RCP8.5) showed an increase in lightning events of 112% in Arctic areas where permafrost happens to be prevalent by the end of the century (2081-2100). Furthermore, they also projected potential positive feedback in which increased lightning frequency, and therefore wildfires in the Arctic, may cause increased melting of permafrost, which emits CO2 and enhances global warming, which in turn increases lightning and wildfire frequency.
Figure 4 shows the determined current and modeled future relationship between the rate of change in lightning flashes and the relative distance north of tree line.

Technical Notes
Much of the observed lightning frequency data comes from the CLDN, which is operated by ECCC. The network consists of over 80 lightning sensors distributed Canada-wide to monitor lightning events across the country. The CLDN was established in 1998 and has evolved since that time with new sensors and upgraded sensors up to present day (Ref. 8). Due to this network evolution, longer term data trends in lightning events are difficult to differentiate from trends arising due to changes in the CLDN over time. When working with long-term data from the CLDN, these changes must be corrected for (Ref. 8).
The paper by Holzworth et al. (Ref. 10) uses the WWLLN which records lightning strokes north of 65°N latitude. While WWLLN sensors can detect lightning thousands of kilometers away, the efficiency and accuracy of these recordings is reduced in areas where there are no sensors nearby. This may apply to the NWT as there are currently no WWLLN sensors within the territory.
Holzworth et al. (Ref. 10) also notes that the WWLLN has been growing ever since it was formed, resulting in a greater detection efficiency over time. They discuss a correlation between the number of stations and the global number of lightning strokes detected each year. To account for this, a correction was applied to the number of high-latitude lightning strokes over time. This correction was applied by multiplying the number of high latitude strokes each year by the ratio of the average number of stations after 2014 (59.9) to the number of stations in that year.
References
Ref. 1. Kochtubajda, Bohdan, Ronald E. Stewart, Mike D. Flannigan, Barrie R. Bonsal, Charles Cuell & Curtis J. Mooney. 2019. An Assessment of Surface and Atmospheric Conditions Associated with the Extreme 2014 Wildfire Season in Canada’s Northwest Territories, Atmosphere-Ocean, 57:1, 73-90, DOI: 10.1080/07055900.2019.1576023.
Ref. 2. Government of the Northwest Territories – Environment and Climate Change. 2021. Managing Wildfire in the NWT. Available at: https://www.ecc.gov.nt.ca/en/services/wildfire-operations/managing-wildfire.
Ref. 3. Uman, M. A. 1984. Lightning. Dover, 320 pp.
Ref. 4. Rakov, V. A. and Uman, M. A. 2003. Lightning: physics and effects. New York (NY): Cambridge University Press, 687 pp.
Ref. 5. Dwyer, J. D. and Uman, M. A. 2014. The physics of lightning. Physics Reports, 534 (4) 147-241.
Ref. 6. Brown, Daniel & Gerhard Reuter. 2017. The Effect of the Canadian Shield on Cloud-to-Ground Lightning Density, Atmosphere-Ocean, 55:3, 133-143, DOI: 10.1080/07055900.2017.1316699.
Ref. 7. Government of Canada – Environment and Climate Change Canada (ECCC). 2016. Canadian Lightning Detection Network. Available at: https://www.canada.ca/en/environment-climate-change/services/lightning/canadian-detection-network.html.
Ref. 8. Burrows, William R. & Bohdan Kochtubajda. 2010. A decade of cloud‐to‐ground lightning in Canada: 1999–2008. Part 1: Flash density and occurrence, Atmosphere-Ocean, 48:3, 177-194, DOI: 10.3137/AO1118.2010.
Ref. 9. Strong, G. S. 2010. Atmospheric moisture budget estimates of regional evapotranspiration from RES-91. Atmosphere-Ocean, 35:1, pp. 29-63.
Ref. 10. Holzworth, R. H., Brundell, J. B., McCarthy, M. P., Jacobson, A. R., Rodger, C. J., and Anderson, T. S. 2021. Lightning in the Arctic. Geophysical Research Letters, 48:7.
Ref. 11. Brown, Daniel M., Bohdan Kochtubajda & Ryan K. Said. 2020. A Severe Thunderstorm Outbreak North of 70°N Over the Canadian Arctic Islands with Unusual Lightning Characteristics. Atmosphere-Ocean, DOI: 10.1080/07055900.2020.1792405.
Ref. 12. Chen, Y., Romps, D. M., Seeley, J. T., Veraverbeke, S., Riley, W. J., Mekonnen, Z. A., and Randerson, J. T. 2021. Future increases in Arctic lightning and fire risk for permafrost carbon. Nature Climate Change, v. 11, 404-410.
2.3. Projected temperature and precipitation in the NWT

This indicator tracks the projections of air temperature and precipitation for northern Canada, but also includes projections for Canada as a whole. Climate projections are based on computer models that represent the complex global climate system. The projections incorporate various future scenarios of greenhouse gas (GHG) emissions, aerosols (droplets or tiny particles in the atmosphere), and land-use change (Ref. 1). While GHG emissions have a net warming effect on the atmosphere, aerosols affect climate differently according to their physical and chemical properties. For instance, some aerosols enable cloud formation, increasing the reflectivity of the atmosphere resulting in net cooling, while other aerosols, like black carbon (soot) absorb heat and reduce the reflectivity of snow and ice surfaces when deposited, therefore having a net warming effect. GHG emissions and aerosols are mechanisms which cause a net change in the energy balance of the Earth system, thereby forcing a net cooling or net warming effect (Ref. 2).
Climate projections arise from scenarios of future GHG and aerosol emissions, which are based on assumptions about how human activities, such as global fossil fuel consumption and land-use, will change (Ref. 1). Projections are generally described based on a suite of future forcing scenarios called Representative Concentration Pathways (RCPs) which are identified by a number that indicates the change in radiative forcing that will occur globally as a result of the greenhouse effect. The RCP scenarios range from those in which global GHG emissions are aggressively reduced, to those with limited actions taken to mitigate emissions.
RCP2.6 represents a low emission scenario, RCP4.5 and RCP6 represent medium emissions scenarios, and RCP8.5 represents a high emissions scenario. In the high emissions scenario, GHG emissions continue to grow resulting in a 3.7°C increase in atmospheric temperature in Canada by the end of the 21st century (Ref. 1). Future GHG emissions from human activity, particularly CO2 from the burning of fossil fuels, will largely determine the magnitude of climate change over the 21st century. Therefore, reducing GHG emissions through mitigation efforts will reduce future climate change.
Global model results can be downscaled into more detailed regional projections better suited to decision making at national, provincial, territorial, or regional scales. It is important to keep in mind that while downscaling provides more regional detail, the uncertainty of projections is greater at smaller spatial scales (Ref. 3).
This indicator was prepared by the Government of the Northwest Territories, Department of Environment and Climate Change, using information obtained from a number of sources, including the Intergovernmental Panel on Climate Change (Ref. 2) and the Canada’s Changing Climate Report published by Environment and Climate Change Canada (ECCC) in 2019 (Ref. 1, Ref. 4).
NWT Focus
Between 1948 and 2016, Canada’s mean annual temperature increased by 1.7°C, and by 2.3°C for northern Canada (Ref. 4). It is clear that climate change is affecting the north to a far greater extent than the rest of the world. To prepare for ongoing effects, it is imperative that we understand future projections of climate change.
This indicator presents climate projections based on the high and low emission scenarios for northern Canada and Canada as a whole. The projections provide information on a number of climate indices, like mean annual air temperature, minimum and maximum air temperatures, length of the growing season, and mean annual precipitation. The projection scenarios provide a range of future climate possibilities based on future global GHG emissions.
Climate projections provide essential information for future planning, so that decision makers may proactively prepare, adapt, and increase our resilience to climate change.
Current View: status and trend
Temperature – Northern Canada
Projections indicate that in the near future (2031-2050) the climatic response to all emission scenarios will be similar; however, by the end of the 21st century (2081-2100), these emission scenarios will have considerably diverged. Under the low emission scenario, annual mean air temperature in northern Canada will likely stabilize at about 2.1 °C above the reference period (1986-2005) near 2050. Under the high emission scenario, temperature in northern Canada will continue to increase throughout the 21st century and beyond, reaching a mean annual air temperature rise of approximately 7.8 °C above the reference period by 2100 (Figure 1). The significantly greater warming under the high emission scenario illustrates need for substantive mitigation efforts to realize long-term climate benefits.
Temperature – Canada-Wide
In the near future (2031-2050), the difference in the pattern and magnitude of annual warming between the low emission scenario (RCP2.6) and the high emission scenario (RCP8.5) is about 0.5 °C to 1 °C. However, by the late 21st century (2081-2100), this modest difference between emission scenarios will have grown substantially. Under the high emissions scenario, projected mean annual air temperature will increase by more than 4 °C over the low emission scenario. The difference is even larger for the winter season (Figure 2, Figure 3).
Warming will not occur uniformly across all seasons. High-latitude amplification of warming is expected to be greatest during the winter. The enhanced winter warming is due to a phenomenon known as Arctic amplification. As global temperatures increase, the spatial extent of snow and sea ice in the north is declining. Snow and ice have a high reflectivity, meaning they reflect the majority of incident solar radiation they receive, rather than absorbing it as heat, which contributes to maintaining a colder climate in Arctic regions. Land and oceans have a lower reflectivity meaning their reflectivity is reduced, allowing more radiation, and thus heat, to be absorbed. As sea ice extent and snow cover declines, surface albedo is reduced and more solar radiation can be absorbed by the newly exposed land and ocean, further increasing air temperature. This Arctic amplification is an important contributor to the higher rate of warming in the Canadian Arctic and Canada compared to the rest of the world (Ref. 1; Figure 4).


ClimateData.ca provides downscaled daily climate model predictions to reflect regional climate trends and projections across Canada. In Hay River, the annual mean air temperature was -3.4 °C from 1951 to1980 and -2.4 °C from 1981 to 2010. Under a high emission scenario, annual mean air temperature is projected to be -0.5 °C for 2021 to 2050, 2.2 °C for 2051 to 2080, and 3.8 °C for 2081 to2100 (Figure 5A).
In Inuvik, annual mean air temperature was -9.6 °C from 1951 to1980 and -8 °C from 1981 to 2010. Under a high emission scenario, the annual mean air temperature is projected to be -5.9 °C for 2021 to 2050, -2.8 °C for 2051 to 2080, and -0.6 °C for 2081to2100 (Figure 5B). This is an example of projected air temperature increasing with latitude and can be attributed in part to Arctic amplification.

Indicators of temperature change can go beyond the analysis of annual mean temperature. Analysis of projected daily extreme temperatures and the length of the growing season can provide important information for decision making and future planning. For example, a longer projected growing season could provide opportunities for expanded agriculture in the NWT, however it could also have negative implications in other areas such as increased invasive species and increased wildfires due to a longer fire season.
In northern Canada, the annual highest daily maximum temperature is projected to increase by 1.3 °C and 1.8 °C between 2031 and2050 under a low emission (RCP2.6) and high emission scenario (RCP8.5), respectively, compared to the 1986 to 2005 reference period (Ref. 4). Between 2081 and 2100, the daily maximum temperature is projected to increase by 1.5 °C under a low emission scenario, whereas a much greater increase of approximately 5.7 °C is expected under a high emission scenario (Table 1).
A similar pattern can be observed with projections of annual highest daily minimum temperature. Under a low emission scenario, daily minimum temperatures in the NWT will rise on average by 1.3 °C and 1.5 °C between 2031and 2050 and 2081 to2100, respectively (Ref. 4). Under a high emission scenario, these changes are of greater magnitude, with daily minimum temperatures rising on average by 3.9 °C and 11.1 °C between 2031 and2050 and 2081to 2100, respectively. These projections are consistent with Canada-wide projections of hotter summers and milder winters. Extreme hot temperatures are expected to become more frequent while extreme cold temperatures are expected to become less frequent, particularly under the high emission scenario (Table 1).
The length of the growing season, which has been defined in Canada’s Changing Climate Report as the number of days where there are six consecutive days with a daily mean temperature above 5 °C, is projected to increase in northern Canada (Ref. 4). Under the low emission scenario, the growing season will lengthen by 8.8 days from 2031 to2050 and by 10.2 days between 2081 and 2100. Under a high emission scenario, the length of the growing season will increase by 12.9 days between 2031and 2050 and by 37.8 days from 2081to 2100 (Table 1).
Table 1: Projected changes in indicators of temperature under the low (RCP 2.6) and high (RCP 8.5) emission scenarios, based on statistically downscaled temperature from simulations by 24 Earth system models. Northern Canada is defined by political boundaries and includes the three territories. Source: Canada’s Change Climate Report, Chapter 4 (Ref. 4).
|
Median (25%, 75% Percentile) |
||||
|
Region |
RCP2.6 |
RCP8.5 |
||
|
2031-2050 |
2081-2100 |
2031-2050 |
2081-2100 |
|
|
Annual highest daily maximum temperature (°C) |
||||
|
Northern Canada |
1.3 (0.6, 2.2) |
1.5 (0.7, 2.2) |
1.8 (0.9, 2.7) |
5.7 (3.6, 7.3) |
|
Canada |
1.4 (0.7, 2.3) |
1.5 (0.8, 2.2) |
2.0 (1.2, 2.8) |
6.1 (4.2, 7.5) |
|
Annual highest daily minimum temperature (°C) |
||||
|
Northern Canada |
2.6 (1.8, 3.4) |
2.9 (1.9, 4.0) |
3.9 (3.0, 4.8) |
11.1 (9.4, 14.0) |
|
Canada |
2.5 (1.7, 3.5) |
2.8 (1.8, 4.1) |
3.8 (2.9, 4.9) |
11.2 (9.5, 13.8) |
|
Length of growing season (days) |
||||
|
Northern Canada |
8.8 (4.7, 13.4) |
10.2 (5.0, 15.3) |
12.9 (7.3, 18.4) |
37.8 (25.5, 49.9) |
|
Canada |
10.8 (6.3, 15.6) |
12.4 (7.0, 17.7) |
15.3 (9.9, 20.9) |
42.8 (31.9, 53.8) |
Precipitation
Precipitation exhibits more variation over time and space than changes in temperature; therefore confidence in future projections for precipitation are much lower than projections for temperature (Ref. 4). There is much uncertainty in national precipitation projections, especially in northern Canada. While there is high confidence in the projected increase in annual precipitation in the north, confidence in projected changes in seasonal mean precipitation is lower.
Unlike mean air temperature, which is expected to increase everywhere in Canada, precipitation is projected to differ among regions; some areas will likely experience an overall increase or decrease in precipitation over time. In the near future (2031-2050), an increase in precipitation of less than 10% is projected across Canada. By the end of the 21st century (2081-2100), changes in precipitation are expected to be much larger under the high emission scenario, with increases of more than 30% in Canada’s High Arctic (Table 2). Given annual mean precipitation is quite low in the Arctic, small changes in the amount of precipitation can translate into a large percentage change.
Table 2: Projected percentage change in annual mean precipitation relative to the 1986-2005 reference period. The median or 50th percentile value is based on the CMIP5 multi-model ensemble. The 25th percentile values indicate that 25% of the CMIP5 model projections have a change smaller than this value. The 75th percentile values indicate that 25% of the CMIP5 model projections have a change larger than this value. Northern Canada is defined by political boundaries and includes the three territories. Source: Canada’s Changing Climate Report, Chapter 4 (Ref. 4).
|
Median (25%, 75% Percentile), % |
||||
|
Region |
RCP2.6 |
RCP8.5 |
||
|
2031-2050 |
2081-2100 |
2031-2050 |
2081-2100 |
|
|
Projected percentage change in annual mean precipitation relative to 1986-2005 |
||||
|
Northern Canada |
8.2 (2.1, 14.6) |
9.4 (2.8, 16.7) |
11.3 (5.4, 18.1) |
33.3 (22.1, 46.4) |
|
Canada |
5.5 (0.2, 11.2) |
6.8 (0.4, 14.4) |
7.3 (2.0, 13.2) |
24.2 (13.7, 36.2) |
Warmer air can hold more water vapour; thus precipitation generally increases from north to south. A greater increase in air temperature is projected for northern Canada (compared to southern Canada), therefore, the proportional increase in water carrying capacity of the atmosphere will be greater in the north. This is one reason for the larger projected increase in precipitation in northern Canada, particularly under a high emission scenario.

Figure 6: Projected annual precipitation change (%) in Canada. Changes are relative to the 1986-2005 period. Maps A and B show projected precipitation change for the 2031-2050 period, and maps C and D for the 2081-2100 period, under the low (RCP 2.6) and high (RCP 8.5) emission scenarios. Source: Canada’s Changing Climate Report, Chapter 4 (Ref. 4). Permission granted through a free use policy.
In northern Canada, the likelihood of precipitation falling as rain rather than snow is projected to increase through the 21st century, especially in spring and autumn. The latter could increase the frequency of rain on snow events (Figure 6).
Seasonal projections show a significant increase in precipitation in regions of the NWT under low and high emission scenarios, both in the near (2031-2050) and later (2081-2100) time periods. Under a high emission scenario, national projections show negligible differences in normalized precipitation in the 21st century due to the projected increase in precipitation in northern Canada and projected decrease in southern Canada (Ref. 4). In the North, increases in precipitation are projected in every season, particularly in the winter (Figure 7, Figure 8).


At a regional scale, similar patterns can be observed between high and low latitudes. In Hay River, mean annual precipitation for the 1951 to1980 reference period was 335 mm. Under a high emission scenario, mean annual precipitation is projected to increase by 12% between 2021 and 2050, by 16% from 2051 to 2080, and by 24% between 2081 and2100 (Figure 9A). In Inuvik, mean annual precipitation for the 1951-1980 period was 256 mm. Under a high emission scenario, mean annual precipitation is projected to increase by 13% between 2021 and2050, by 26% from 2051 to2080, and by 32% between 2081 and2100 (Figure 9B).
The greater percentage change in precipitation in Inuvik is reflective of the amplification of climate change at higher latitudes.

Figure 9: Annual total precipitation projections derived from climatedata.ca for Hay River (A) and Inuvik (B) under the low (RCP 2.6; blue line), medium (RCP 4.5; green line), and high (RCP 8.5; red line) emission scenarios. Displayed results are from an ensemble of 24 climate models. Each model simulates historical climate (1950-2005) and the plausible future scenarios (2006-2100) in response to the three emissions scenarios. Bold lines represent median values (50th percentile) of the climate model ensemble. The shaded data range is defined by the 10th and 90th percentile values of the climate model ensemble. Source: climatedata.ca (Ref. 5). Permission to use this graph has been granted by the Canadian Centre for Climate Services.
Looking around
Projected global warming will be similar under all emission scenarios until approximately 2040 when temperature projections begin to diverge. The level of warming thereafter will be dependent on the extent to which global emissions grow or decline. By the end of the 21st century, the global climate will warm by an additional 1.0 °C or 3.7 °C under a low emission (RCP2.6) or high emission (RCP8.5) scenario, respectively (Ref. 1).
In Canada, climate projections indicate significant changes in the return period of extreme precipitation events. Under a low emission scenario, the frequency of extreme precipitation events will increase until mid-century when changes are projected to stabilize. Under a high emission scenario, extreme precipitation events are projected to occur more frequently by the end of the 21st century (i.e., once in approximately 20 years event to once in five years event) (Ref. 4).
Looking forward
Global temperature change is effectively irreversible on multi-century timescales due to the long lifetime of CO2 in the atmosphere (Ref. 1). In fact, global mean air temperature will continue to rise with continuous GHG emissions and will remain elevated for centuries regardless of whether GHG emissions become net zero. However, given the significant changes that could occur in a high emissions scenario it is apparent that substantial action to reduce emissions is necessary.
While some climate change impacts, like a longer ice-free season, may provide some positive outcomes such as enhanced tourism and greater access to northern shipping lanes, other climate change impacts will have predominantly negative outcomes. The NWT is vulnerable to climate change, and impacts to the environment, human infrastructure, and traditional ways of life may occur due to widespread permafrost thaw, greater coastal and riverbank erosion, increased risk of wildfires, changes to water quality and quantity, changes to forests and tundra vegetation, and changes to wildlife, freshwater fish and marine mammal health, distribution and habitat, among other impacts.
Find out more
For more information on climate scenarios and climate model concepts, refer to A Guidebook on Climate Scenarios published by Ouranos in 2016: https://www.ouranos.ca/publication-scientifique/Guidebook-2016.pdf.
To view climate projections specific to your community or region, visit www.climatedata.ca.
For more information on seasonal and annual climate information, visit the Climate Trends and Variation Bulletin published online by Environment and Climate Change Canada - http://publications.gc.ca/site/eng/9.507871/publication.html.
To read more about climate change in Canada, download the complete Canada’s Changing Climate Report at: https://changingclimate.ca/CCCR2019/.
Technical Notes
RCPs are used in current climate projections to indicate various future GHG emissions scenarios. The IPCC Fifth Assessment Report and the Canada’s Changing Climate Report uses the RCP scenarios described in this report.
The selection of 5 °C as the minimum temperature requirement for the growing season is arbitrary. The actual growing season is different for different plant species. The relative changes in the start, end and length of the growing season, however, are relevant to all species and ecosystems.
ClimateData.ca was used for most climate projections in this indicator. Climatedata.ca was created through a collaboration between the Pacific Climate Impacts Consortium (PCIC), Ouranos Inc., the Prairie Climate Centre (PCC), ECCC Centre de Recherche Informatique de Montréal (CRIM), and Habitat7.
References
Ref. 1. Flato, G., Gillett, N., Arora, V., Cannon, A. and Anstey, J. 2019: Modelling Future Climate Change; Chapter 3 in Canada’s Changing Climate Report, (ed.) E. Bush and D.S. Lemmen; Government of Canada, Ottawa, Ontario, p. 74–111.
Ref. 2. Myhre, G., D. Shindell, F.-M. Bréon, W. Collins, J. Fuglestvedt, J. Huang, D. Koch, J.-F. Lamarque, D. Lee, B. Mendoza, T. Nakajima, A. Robock, G. Stephens, T. Takemura and H. Zhang. 2013. Anthropogenic and Natural Radiative Forcing. In: Climate Change 2013: The Physical Science Basis. Contribution of Working Group I to the Fifth Assessment Report of the Intergovernmental Panel on Climate Change [Stocker, T.F., D. Qin, G.-K. Plattner, M. Tignor, S.K. Allen, J. Boschung, A. Nauels, Y. Xia, V. Bex and P.M. Midgley (eds.)]. Cambridge University Press, Cambridge, United Kingdom and New York, NY, USA.
Ref. 3. Charron, I. 2016. A Guidebook on Climate Scenarios: Using Climate Information to Guide Adaptation Research and Decisions, 2016 Edition. Ouranos, 94p. Available at: https://www.ouranos.ca/publication-scientifique/Guidebook-2016.pdf
Ref. 4. Zhang, X., Flato, G., Kirchmeier-Young, M., Vincent, L., Wan, H., Wang, X., Rong, R., Fyfe, J., Li, G., Kharin, V.V. 2019: Changes in Temperature and Precipitation Across Canada; Chapter 4 in Bush, E. and Lemmen, D.S. (Eds.) Canada’s Changing Climate Report. Government of Canada, Ottawa, Ontario, pp 112-193.
Ref. 5. Environment and Climate Change Canada, the Computer Research Institute of Montréal, Ouranos, the Pacific Climate Impacts Consortium, the Prairie Climate Centre, and HabitatSeven. Available at: www.climatedata.ca